Quick Answer
Approximately 30–40% of the population in high-income countries is sensitized to at least one pollen allergen. Grass pollen is the most globally prevalent allergen; ragweed sensitizes ~17% of Americans. The North American pollen season extended ~20 days and pollen concentrations increased 21% from 1990 to 2018. Climate change is the primary driver of pollen season extension, with further increases projected.
Key Statistics at a Glance
Sensitization Rates by Pollen Type and Region
| Allergen | Primary Region | Est. Sensitization Rate | Peak Season |
|---|---|---|---|
| Ragweed (Ambrosia) | North America (highest burden) | ~17% of Americans | Aug–Oct |
| Timothy grass | North America, Europe, Australia | 10–20% of general population | May–Jul |
| Birch pollen (Betula) | Northern Europe, NE North America | 25–30% in endemic zones | Mar–May |
| Oak pollen (Quercus) | Southeastern US, Southern Europe | 10–15% (overlap with birch sensitization) | Mar–May |
| Japanese cedar (sugi) | Japan | 25–40% of Japanese population | Feb–Mar |
| Olive pollen (Olea) | Mediterranean basin | 10–30% in Mediterranean countries | Apr–Jun |
| Bermuda grass (Cynodon) | Southern US, Mediterranean, Australia | ~10–15% | May–Aug |
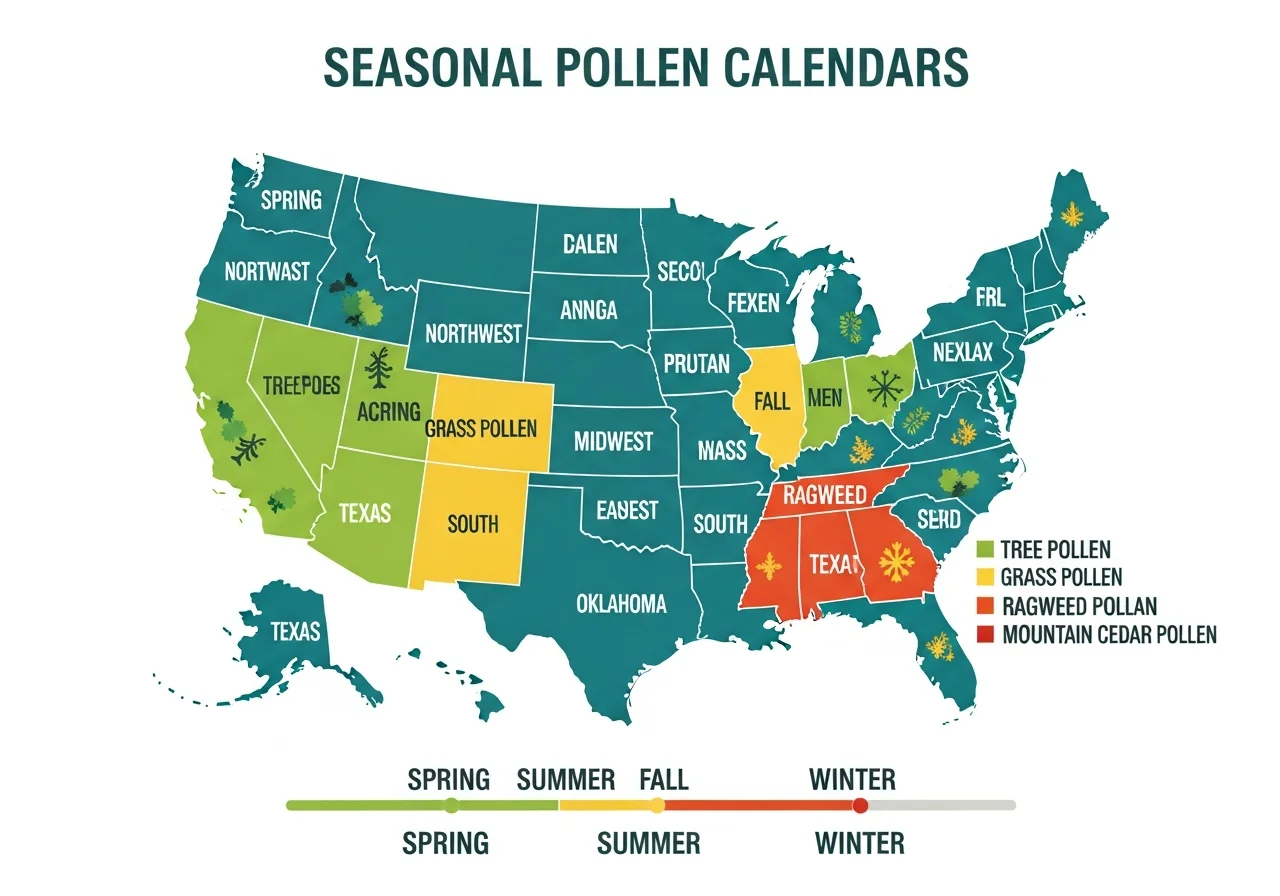
| Mountain cedar (Juniperus) | South-Central US (Texas, Oklahoma) | ~10–15% in region | Nov–Feb |
Climate Change Impact: Quantified Data
The 2021 Anderegg et al. PNAS study — the most rigorous analysis of long-term North American pollen trends — used data from 60 monitoring stations over 1990–2018 and found statistically significant increases in both pollen season length and intensity across virtually all monitored locations. The strongest signals were found in the Central and Eastern US, where ragweed and grass season extension was most pronounced. Warming temperatures — primarily driven by anthropogenic climate change — accounted for approximately 50% of the observed pollen season changes, with the remainder attributable to local factors including land use change.
Laboratory experiments demonstrate a direct mechanistic link: ragweed plants grown under elevated CO₂ concentrations (simulating projected 2050–2100 atmospheric conditions) produce more pollen per plant and pollen of greater potency. A 2000 study by Ziska et al. found ragweed grown in urban heat islands produced substantially more pollen than rural counterparts, foreshadowing the broad population-level effects of warming. See our seasonal allergy regions guide for regional detail and our research center for the latest climate-allergy findings.
Pollen Count Thresholds and Symptom Impact
| Pollen Type | Low (<10 grains/m³) | Moderate (10–50) | High (50–200+) |
|---|---|---|---|
| Tree pollen | Minimal symptoms for most | Symptoms in sensitized individuals | Significant symptoms; outdoor activity limited for sensitized |
| Grass pollen | Minimal symptoms | Moderate symptoms common | Widespread symptoms; asthma risk elevated |
| Ragweed pollen | Low symptoms (low threshold allergen) | Moderate-severe symptoms | Severe symptoms; ER presentations rise |
| Mold spores | Low baseline | Moderate symptoms | Asthma trigger risk; thunderstorm asthma risk |
Pollen-Food Allergy Syndrome: A Growing Overlap
Pollen sensitization increasingly drives cross-reactive food reactions through the pollen-food allergy syndrome (PFAS), previously called oral allergy syndrome. An estimated 30–70% of birch pollen-allergic individuals develop PFAS reactions to apple, carrot, celery, peach, hazelnut, and related foods. As birch pollen seasons extend and birch sensitization rates rise in areas where it was historically uncommon, PFAS prevalence is expected to expand geographically. Ragweed sensitization drives PFAS reactions to melons, zucchini, and banana in approximately 20% of ragweed-allergic individuals. Data on PFAS prevalence is detailed in our food allergies hub.
What the Data Means
The pollen allergy data tells two converging stories. The first is a static burden: hundreds of millions of people globally already suffer pollen-driven allergic rhinitis, and existing sensitization rates justify pollen as the single most prevalent environmental allergy trigger worldwide. The second is a dynamic threat: climate change is systematically extending seasons, increasing concentrations, and potentially expanding the geographic range of high-burden pollen plants — particularly ragweed, which is spreading northward in Europe and altitude upward in mountain regions.
Public health responses have lagged behind. Pollen monitoring networks are sparse globally — the 60 monitoring stations in the PNAS analysis cover a vast North American territory inadequately, and many developing regions have essentially no pollen monitoring infrastructure. Expanding monitoring would enable better forecasting, earlier public health warnings, and improved epidemiological data. See our main statistics hub and global allergy statistics for the broader epidemiological context.
Data Sources & Methodology Note
Primary sources: Anderegg WRL et al., "Anthropogenic climate change is worsening North American pollen seasons," PNAS 2021; AAAAI pollen monitoring network data; Kiotseridis H et al., Clinical & Translational Allergy (European pollen sensitization); Ziska LH et al., Ann Allergy Asthma Immunol 2011 (CO₂ and ragweed pollen); WAO White Book on Allergy 2020 (global sensitization estimates); AAFA Allergy Capitals report (city-level burden). Sensitization prevalence figures reflect SPT or specific-IgE positivity and may overestimate clinical allergy prevalence, as not all sensitized individuals have symptomatic disease.